

Ford Sold More Than Twice As Many Electric Mustangs As Gas Ones
Continuing to top out Ford's sales is the F-Series, followed by the Explorer
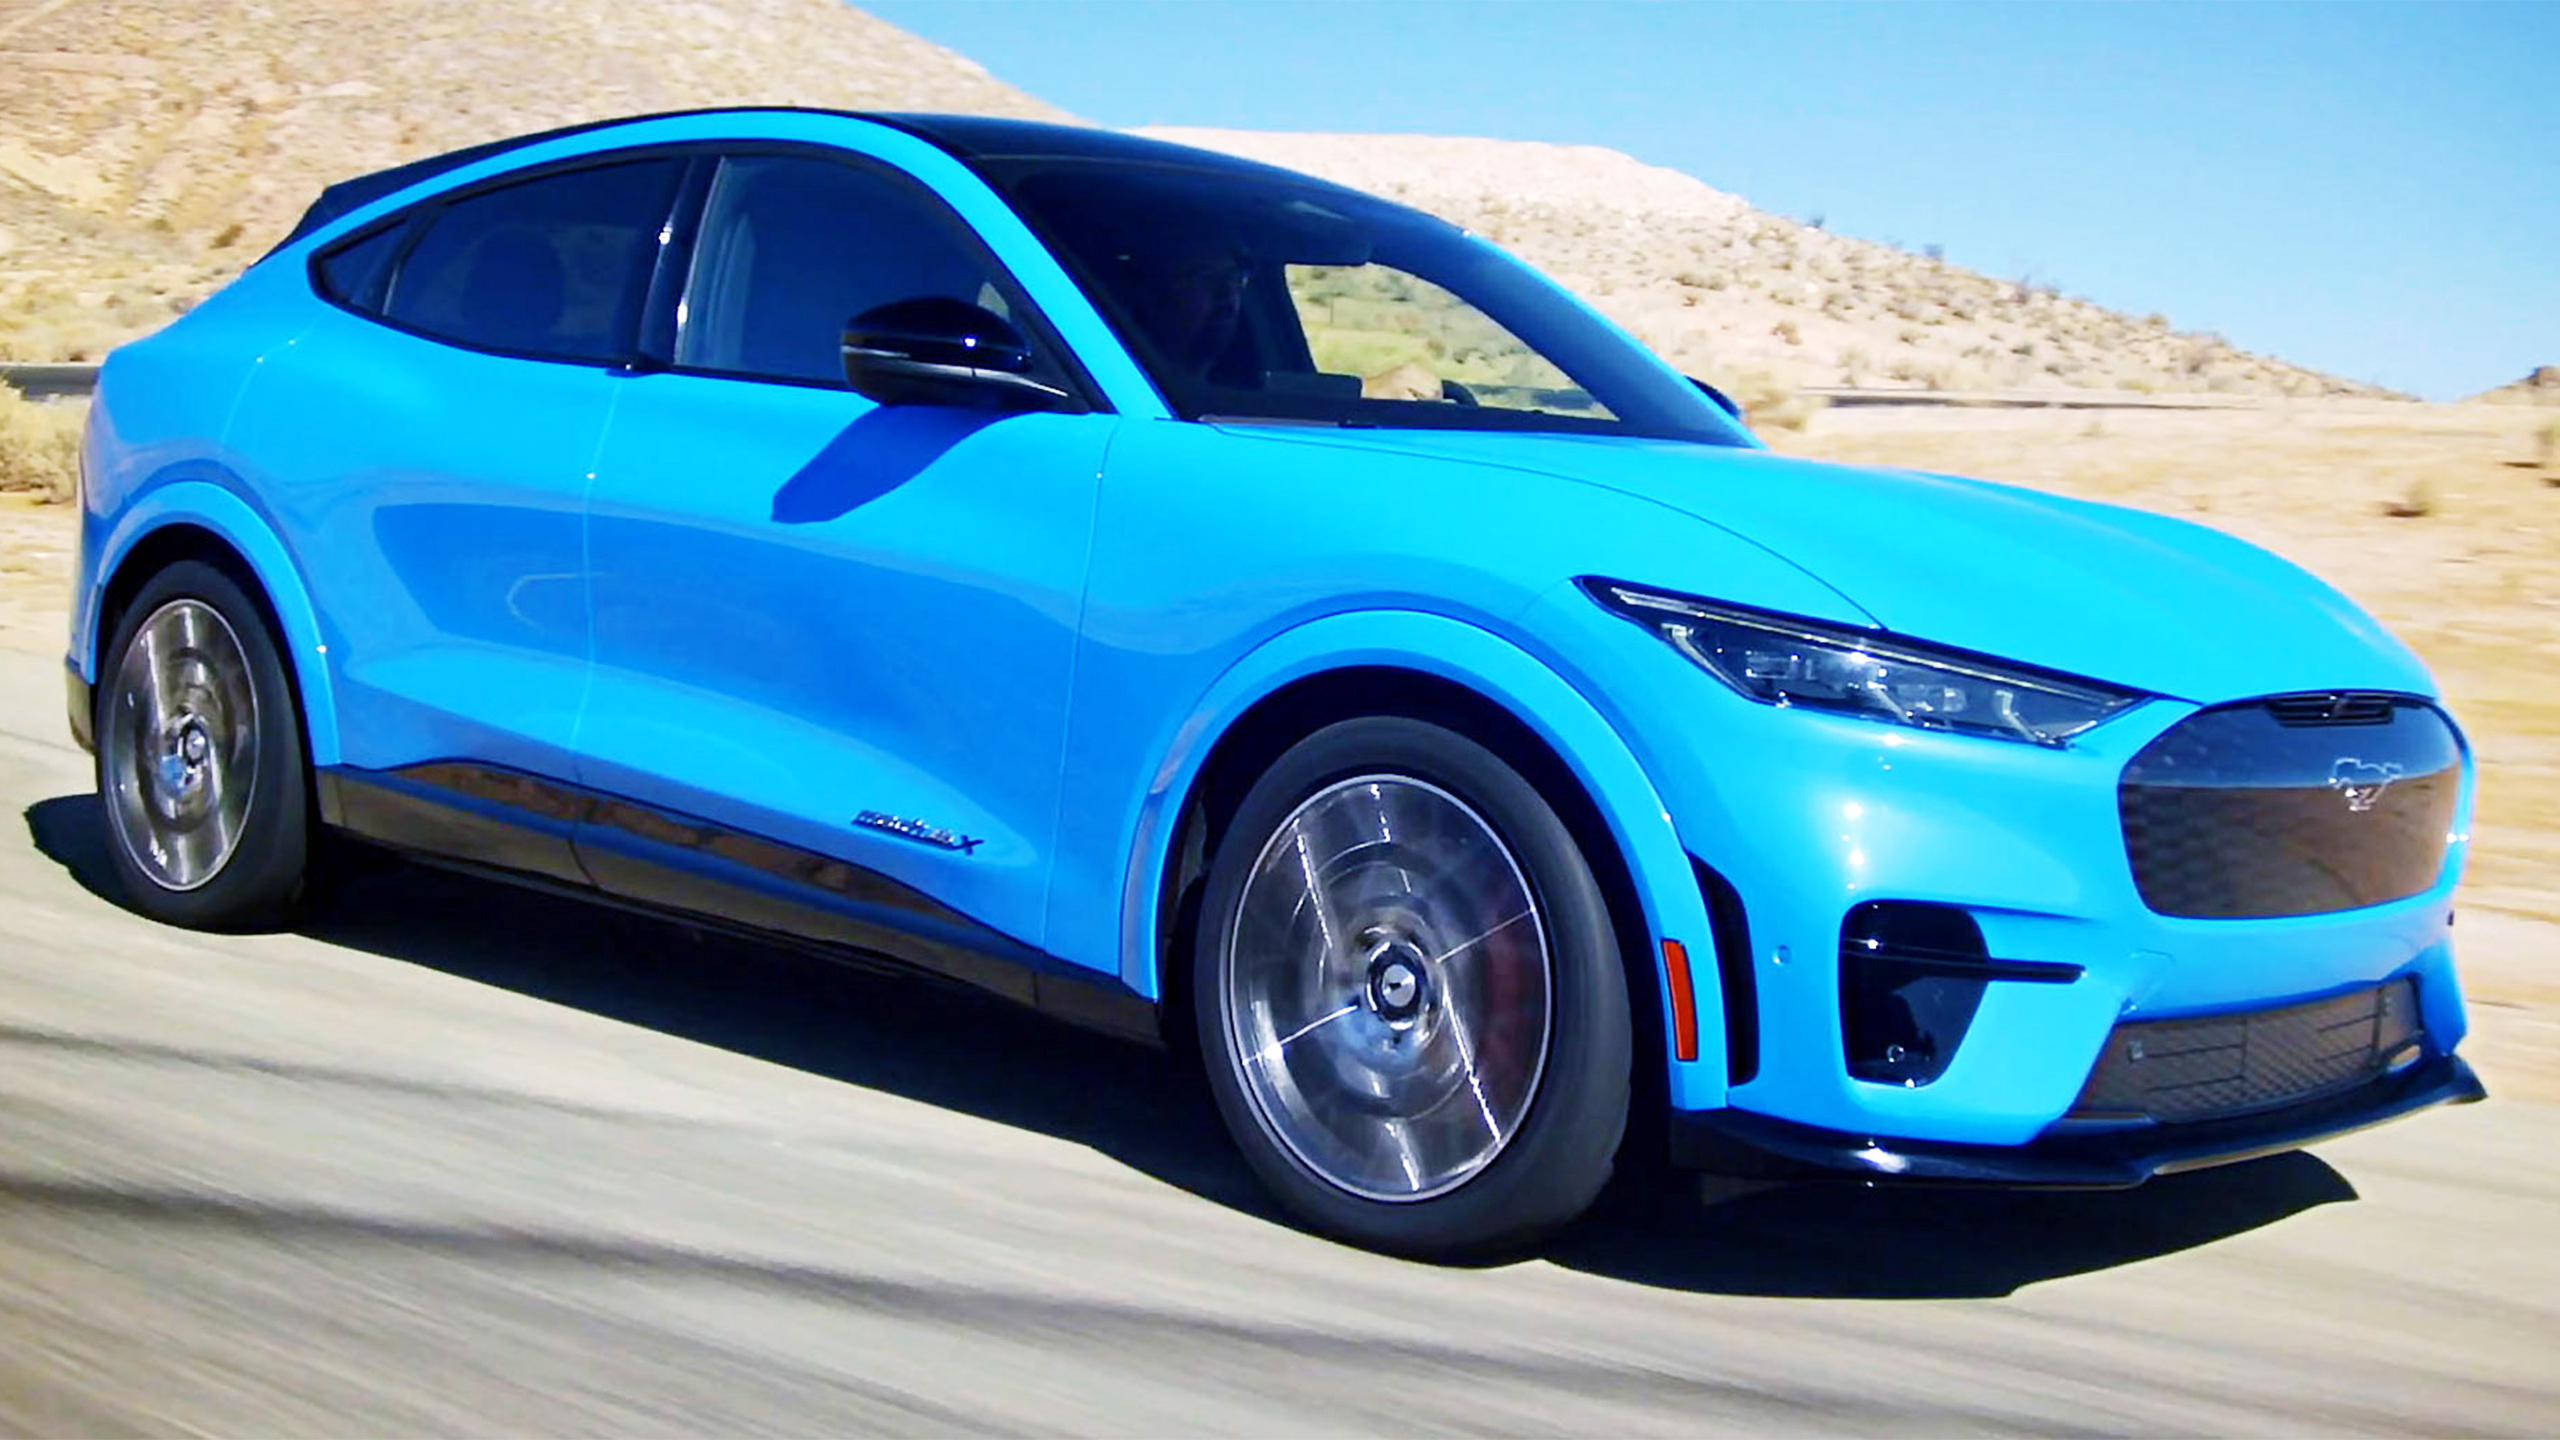
- Ford sold 34K Mach-Es this year, narrowly surpassing the regular Mustang's 31K sales.
- Hybrids boosted Ford's electrified lineup, with sales up nearly 24 percent year-over-year.
The world of cars doesn't always move in straight lines. Once a symbol of raw horsepower and gasoline-soaked nostalgia, the Mustang name is now carrying a very different flag for Ford. The decision to place the Mustang badge on an all-electric crossover stirred plenty of debate, but the numbers show how quickly the landscape shifted.
The Mustang Mach-E may never outsell Tesla's Model Y, yet it's now moving well past the traditional Mustang itself.
Read: Ford Warns Buyers Time Is Running Out For America's Best EV Deals
August sales data released by Ford shows that last month, a total of 7,226 Mustang Mach-Es were sold across the United States. While this represents a small proportion of the total 190,206 vehicles that the Blue Oval shifted across the month, it did represent a significant 35.3 percent increase over the prior year.
Year-to-date, sales of the Mustang Mach-E are also up. Ford has managed to sell 34,319 units through the first eight months of 2025, a 6.7 percent rise from the 32,167 sold over the same period last year.
A Tale of Two Mustangs
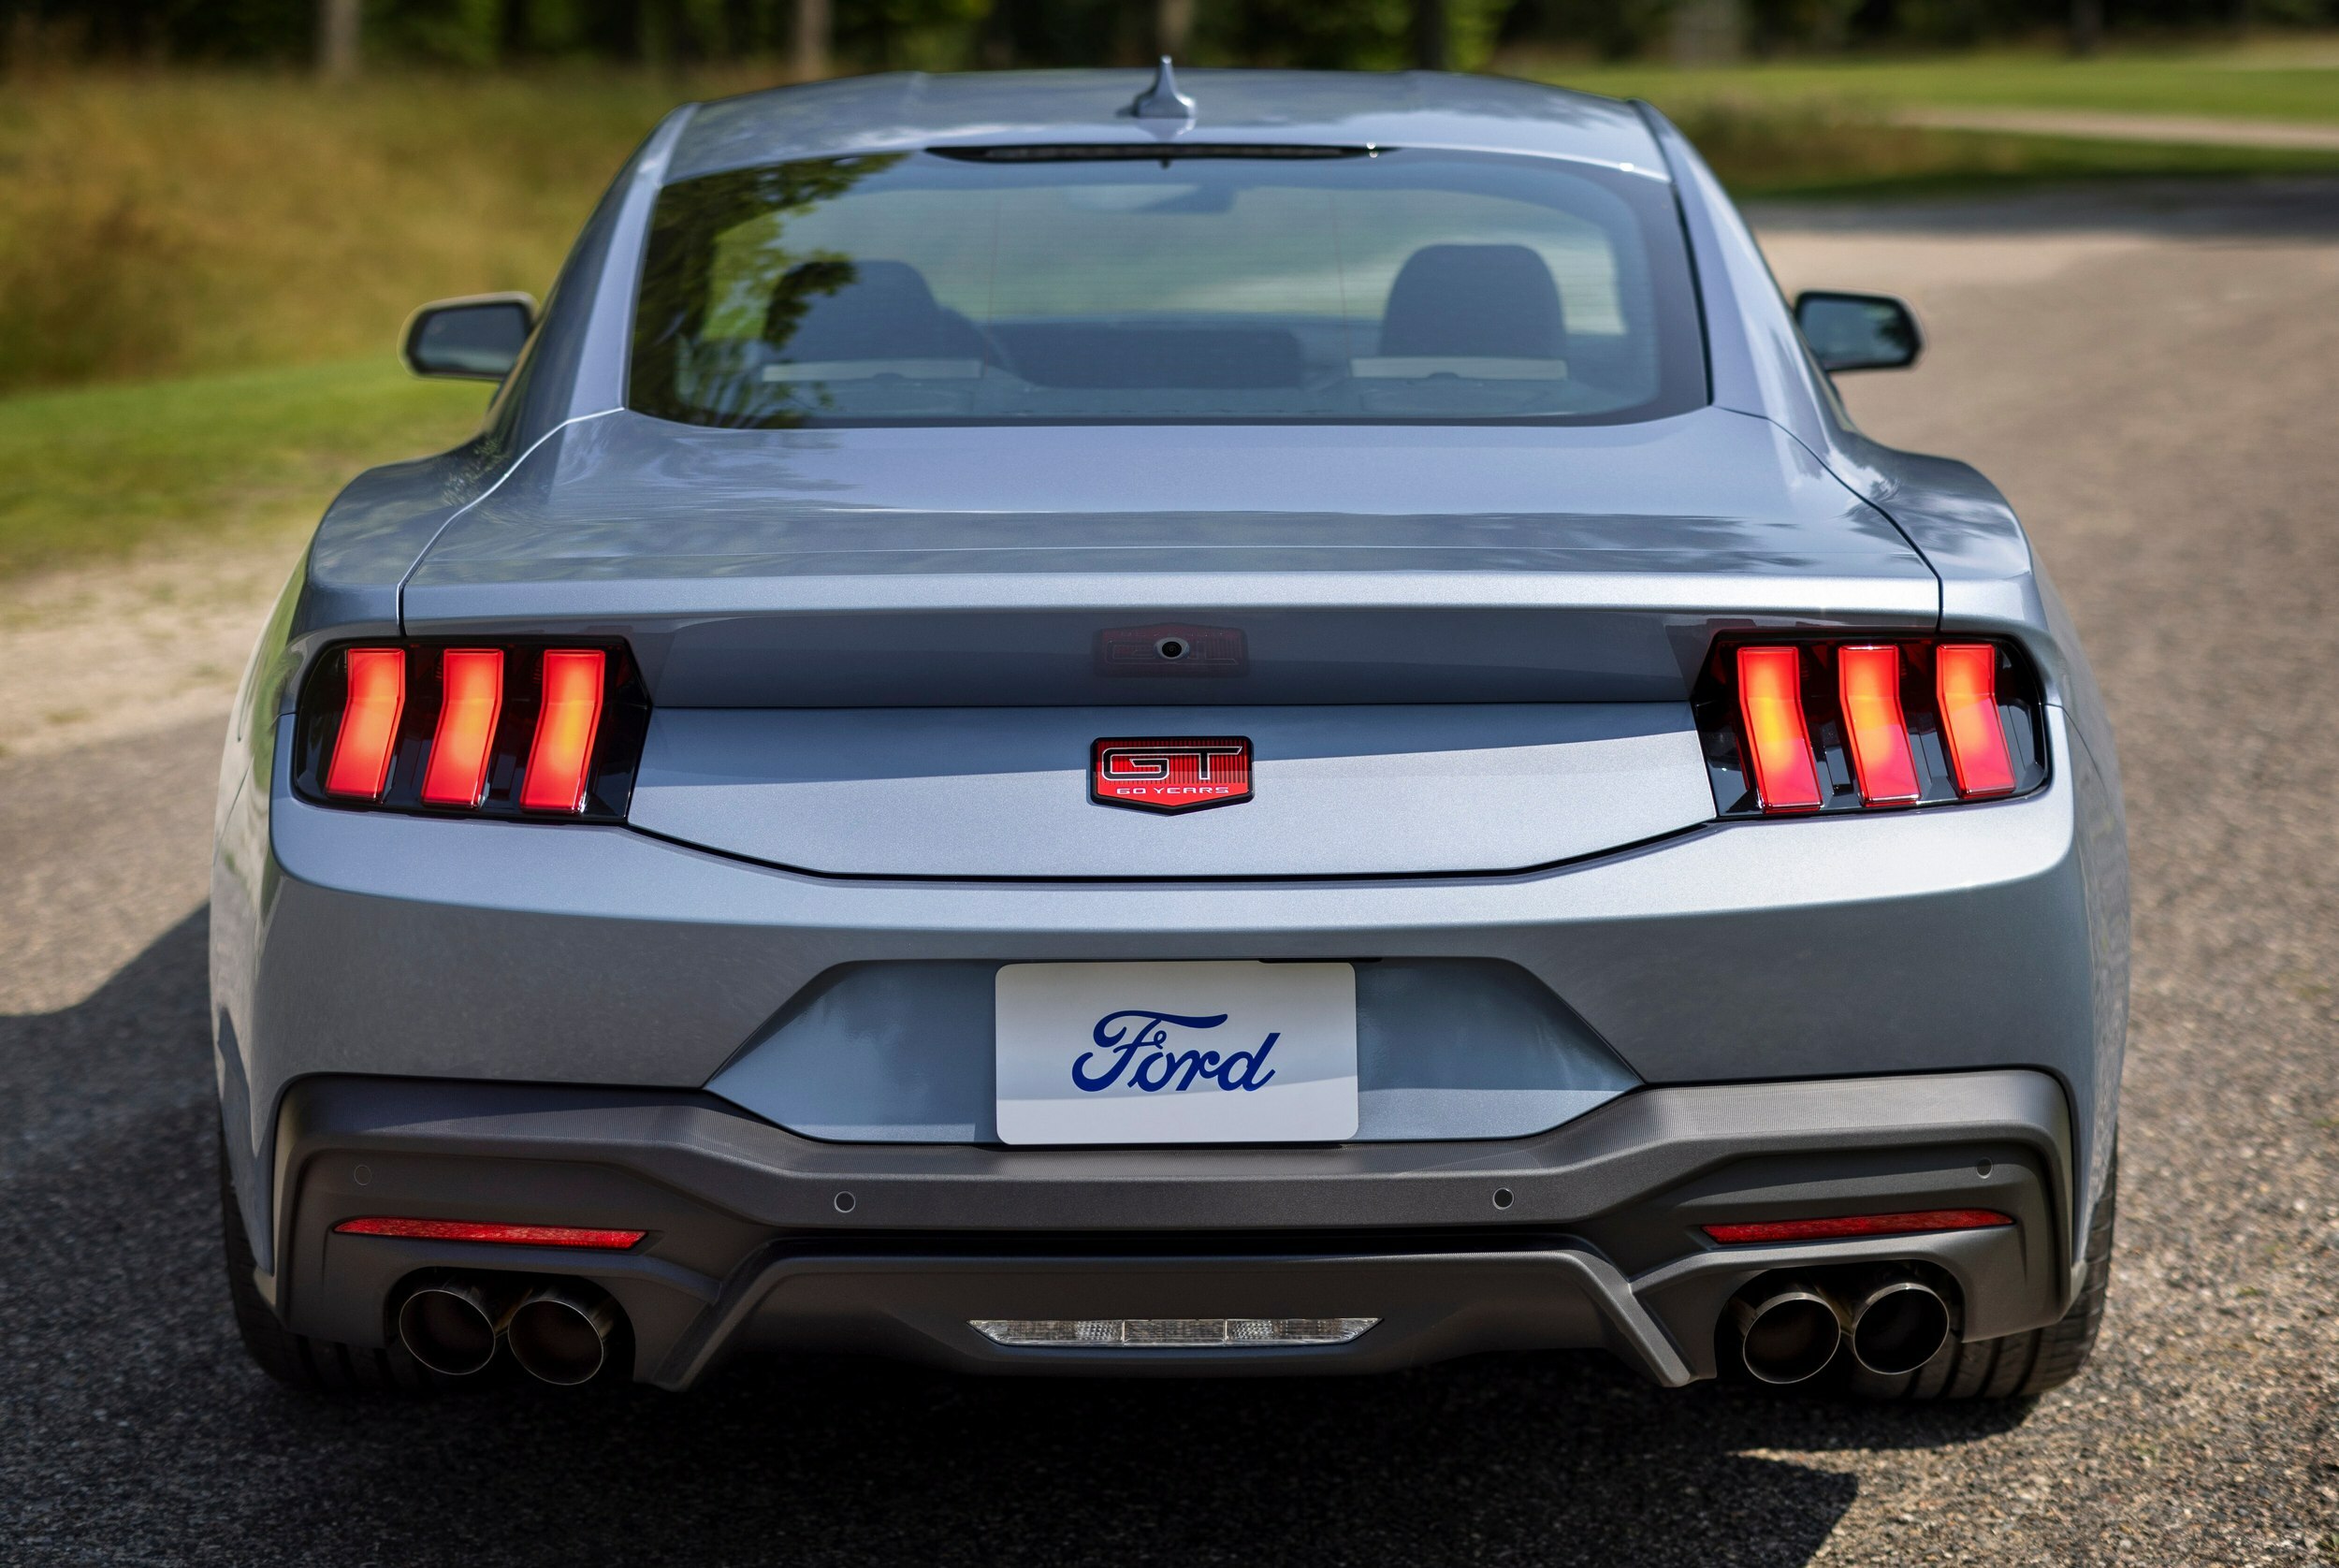
Things aren't looking so pretty for the regular Mustang, particularly in August. This year, a total of 31,015 have been sold across the country. This represents an 8.3 percent decline from the 33,817 that were sold during the January-August period in 2024. So, year-to-date, the Mach E is slightly outpacing the Mustang. However, the discrepancy in August sales is much more stark.
As mentioned, Ford sold 7,226 Mach-Es last month. By comparison, just 3,235 regular Mustangs were delivered, a modest 2.2 percent increase from 3,164 in August 2024. In effect, the Mach-E sold more than twice as many units as the iconic pony car that inspired its name. The sharp rise in Mach-E sales is likely tied to the federal EV tax credit ending this month, which appears to have prompted a last-minute surge in demand.
Looking elsewhere across the Ford range, sales of the F-150 Lightning rose 21.2 percent in August to 3,217 units, but sales are down 9.7 percent year-to-date to 19,077. The F-Series remains Ford's best-selling model, shifting 68,318 units in August, easily outpacing Ford's next best-seller, the Explorer SUV with 20,617 sold.
Hybrids Lead The Charge
Ford sold 10,671 electric vehicles in August, a solid 19.3 percent increase from last year, though year-to-date EV sales are still down 5.7 percent at 57,888. Hybrids, on the other hand, are carrying much of the momentum. With 18,773 sold last month and more than 155,000 moved this year, hybrid sales have surged nearly 24 percent compared to 2024.
Taken together, electrified vehicles now account for a growing slice of Ford's business, pointing to a strategy that leans not only on full EVs but also on hybrids as a bridge for customers still wary of going all-in on electric.
Ford Motor Company August 2025 U.S. Sales
| Category | AUG-25 | AUG-24 | Diff. | YTD-25 | YTD-25 | Diff. |
| Total Electrified Vehicles | 29,444 | 25,338 | 16.2% | 212,995 | 186,828 | 14.0% |
| Electric Vehicles | 10,671 | 8,944 | 19.3% | 57,888 | 61,366 | -5.7% |
| Hybrid Vehicles | 18,773 | 16,394 | 14.5% | 155,107 | 125,462 | 23.6% |
| Internal Combustion | 160,762 | 157,647 | 2.0% | 1,279,910 | 1,213,513 | 5.5% |
| Total Vehicles | 190,206 | 182,985 | 3.9% | 1,492,905 | 1,400,341 | 6.6% |
| SALES BY TYPE | ||||||
| SUVs | 81,539 | 76,810 | 6.2% | 613,800 | 598,962 | 2.5% |
| Trucks | 105,432 | 103,011 | 2.4% | 848,090 | 767,562 | 10.5% |
| Cars | 3,235 | 3,164 | 2.2% | 31,015 | 33,817 | -8.3% |
| FORD BRAND | ||||||
| Bronco Sport | 10,925 | 12,349 | -11.5% | 94,301 | 85,552 | 10.2% |
| Escape | 12,290 | 13,721 | -10.4% | 106,095 | 98,731 | 7.5% |
| Bronco | 13,378 | 10,132 | 32.0% | 99,239 | 69,186 | 43.4% |
| Mustang Mach-E | 7,226 | 5,341 | 35.3% | 34,319 | 32,167 | 6.7% |
| Edge | 0 | 2,858 | -100.0% | 3,040 | 58,518 | -94.8% |
| Explorer | 20,617 | 16,893 | 22.0% | 144,383 | 134,583 | 7.3% |
| Expedition | 8,724 | 5,675 | 53.7% | 61,022 | 53,965 | 13.1% |
| Ford SUVs Total | 73,160 | 66,969 | 9.2% | 542,399 | 532,702 | 1.8% |
| F-Series | 68,318 | 70,701 | -3.4% | 554,704 | 492,099 | 12.7% |
| Memo: F-150 Lightning | 3,217 | 2,654 | 21.2% | 19,077 | 21,121 | -9.7% |
| Ranger | 5,074 | 5,660 | -10.4% | 44,025 | 26,221 | 67.9% |
| Maverick | 11,956 | 10,269 | 16.4% | 110,034 | 100,323 | 9.7% |
| E-Series | 3,531 | 3,364 | 5.0% | 26,571 | 26,417 | 0.6% |
| Transit | 15,660 | 10,652 | 47.0% | 105,178 | 104,451 | 0.7% |
| Memo: E-Transit | 228 | 949 | -76.0% | 4,492 | 8,078 | -44.4% |
| Transit Connect | 0 | 983 | -100.0% | 0 | 8,781 | -100.0% |
| Heavy Trucks | 893 | 1,382 | -35.4% | 7,578 | 9,270 | -18.3% |
| Ford Trucks Total | 105,432 | 103,011 | 2.4% | 848,090 | 767,562 | 10.5% |
| Mustang | 3,235 | 3,164 | 2.2% | 31,015 | 33,817 | -8.3% |
| Ford Cars Total | 3,235 | 3,164 | 2.2% | 31,015 | 33,817 | -8.3% |
| Ford Brand Total | 181,827 | 173,144 | 5.0% | 1,421,504 | 1,334,081 | 6.6% |
| LINCOLN BRAND | ||||||
| Corsair | 2,526 | 2,327 | 8.6% | 17,674 | 17,626 | 0.3% |
| Nautilus | 2,814 | 3,333 | -15.6% | 24,087 | 23,934 | 0.6% |
| Aviator | 1,415 | 2,596 | -45.5% | 14,906 | 14,879 | 0.2% |
| Navigator | 1,624 | 1,585 | 2.5% | 14,734 | 9,821 | 50.0% |
| Lincoln SUVs Total | 8,379 | 9,841 | -14.9% | 71,401 | 66,260 | 7.8% |
| Lincoln Brand Total | 8,379 | 9,841 | -14.9% | 71,401 | 66,260 | 7.8% |