

Sub-$20K Used Cars Accounted For Roughly Half Of The Market Pre-Pandemic, Now They Are Almost Gone
The average price of a one- to five-year-old car has risen by almost 50% in the last four years, which may mean that there are significantly less affordable cars left on the market
During the pandemic, the prices of used vehicles rose so sharply that that factor alone was a leading cause of inflation in the U.S. Now, we're starting to understand the real-world implications of that on consumers.
For example, take the affordable used car. Once a fixture of the used car market, in 2019 about half of one- to five-year-old cars cost less than $20,000, and those vehicles tended to have between 37,000 miles (at the higher-price end of the spectrum) and 72,000 miles (for sub-$10,000 vehicles).
In 2023, just 12.4 percent of one- to five-year-old cars cost less than $20,000. Meanwhile, $10,000 to $15,000 cars went from accounting for about a fifth of the market, to making up just 1.5 percent of it, according to a new study by iSeeCars.
Read: Our Aging Car Population Is Great News For Repair Shops
| Price Range | Market share 19 | Market Share 23 | Change | Avg. Miles 19 | Avg. Miles 23 | Change |
| <$10K | 3% | 0.10% | -97.90% | 72,205 | 116,158 | 60.90% |
| $10K-$15K | 19.90% | 1.50% | -92.60% | 47,886 | 84,710 | 76.90% |
| $15K-$20K | 26.40% | 10.90% | -58.90% | 37,032 | 60,257 | 62.70% |
| $20K-$25K | 17.80% | 19.50% | 9.40% | 34,617 | 45,409 | 31.20% |
| $25K-$30K | 13.80% | 18.20% | 31.60% | 33,810 | 39,565 | 17.00% |
| $30K-$35K | 7.60% | 14.00% | 84.30% | 30,387 | 36,959 | 21.60% |
| $35K-$40K | 4.50% | 11.80% | 160.20% | 29,644 | 34,469 | 16.30% |
| $40K-$45K | 2.50% | 7.30% | 190.60% | 28,406 | 31,212 | 9.90% |
| $45K-$50K | 1.70% | 5.40% | 219.30% | 26,792 | 30,224 | 12.80% |
| $50K-$55K | 0.90% | 3.10% | 245.00% | 23,053 | 29,089 | 26.20% |
| $55K-$60K | 0.70% | 2.30% | 258.40% | 20,077 | 28,614 | 42.50% |
| $60K-$65K | 0.30% | 1.50% | 332.10% | 17,840 | 27,237 | 52.70% |
| $65K-$70K | 0.20% | 1.30% | 479.10% | 16,728 | 25,461 | 52.20% |
| >$70K | 0.60% | 3.20% | 437.70% | 12,334 | 16,368 | 32.70% |
As prices have gone up, so has mileage, meaning that consumers are paying more for vehicles that are likely in worse condition. For example, in 2019, cars that cost $15,000-$20,000 had an average of 37,032 miles on the odometer, and now they have an average of 60,257 miles. And mileages have ballooned even more for $10,000-$15,000 vehicles.
"During the pandemic lockdowns one of the few things people could still do was take a drive, and clearly many of them did," explains Karl Brauer, iSeeCars' executive analyst. "This drove up the mileage across the used car market, but the supply of new and used cars was so constricted that the additional mileage didn't hurt used car prices – they still went up."
Unsurprisingly, then, the average price for all used vehicles has grown significantly. Pre-pandemic, the average one- to five-year-old car cost $23,351. In 2023, that average has gone up by 47.7 percent to $34,491.
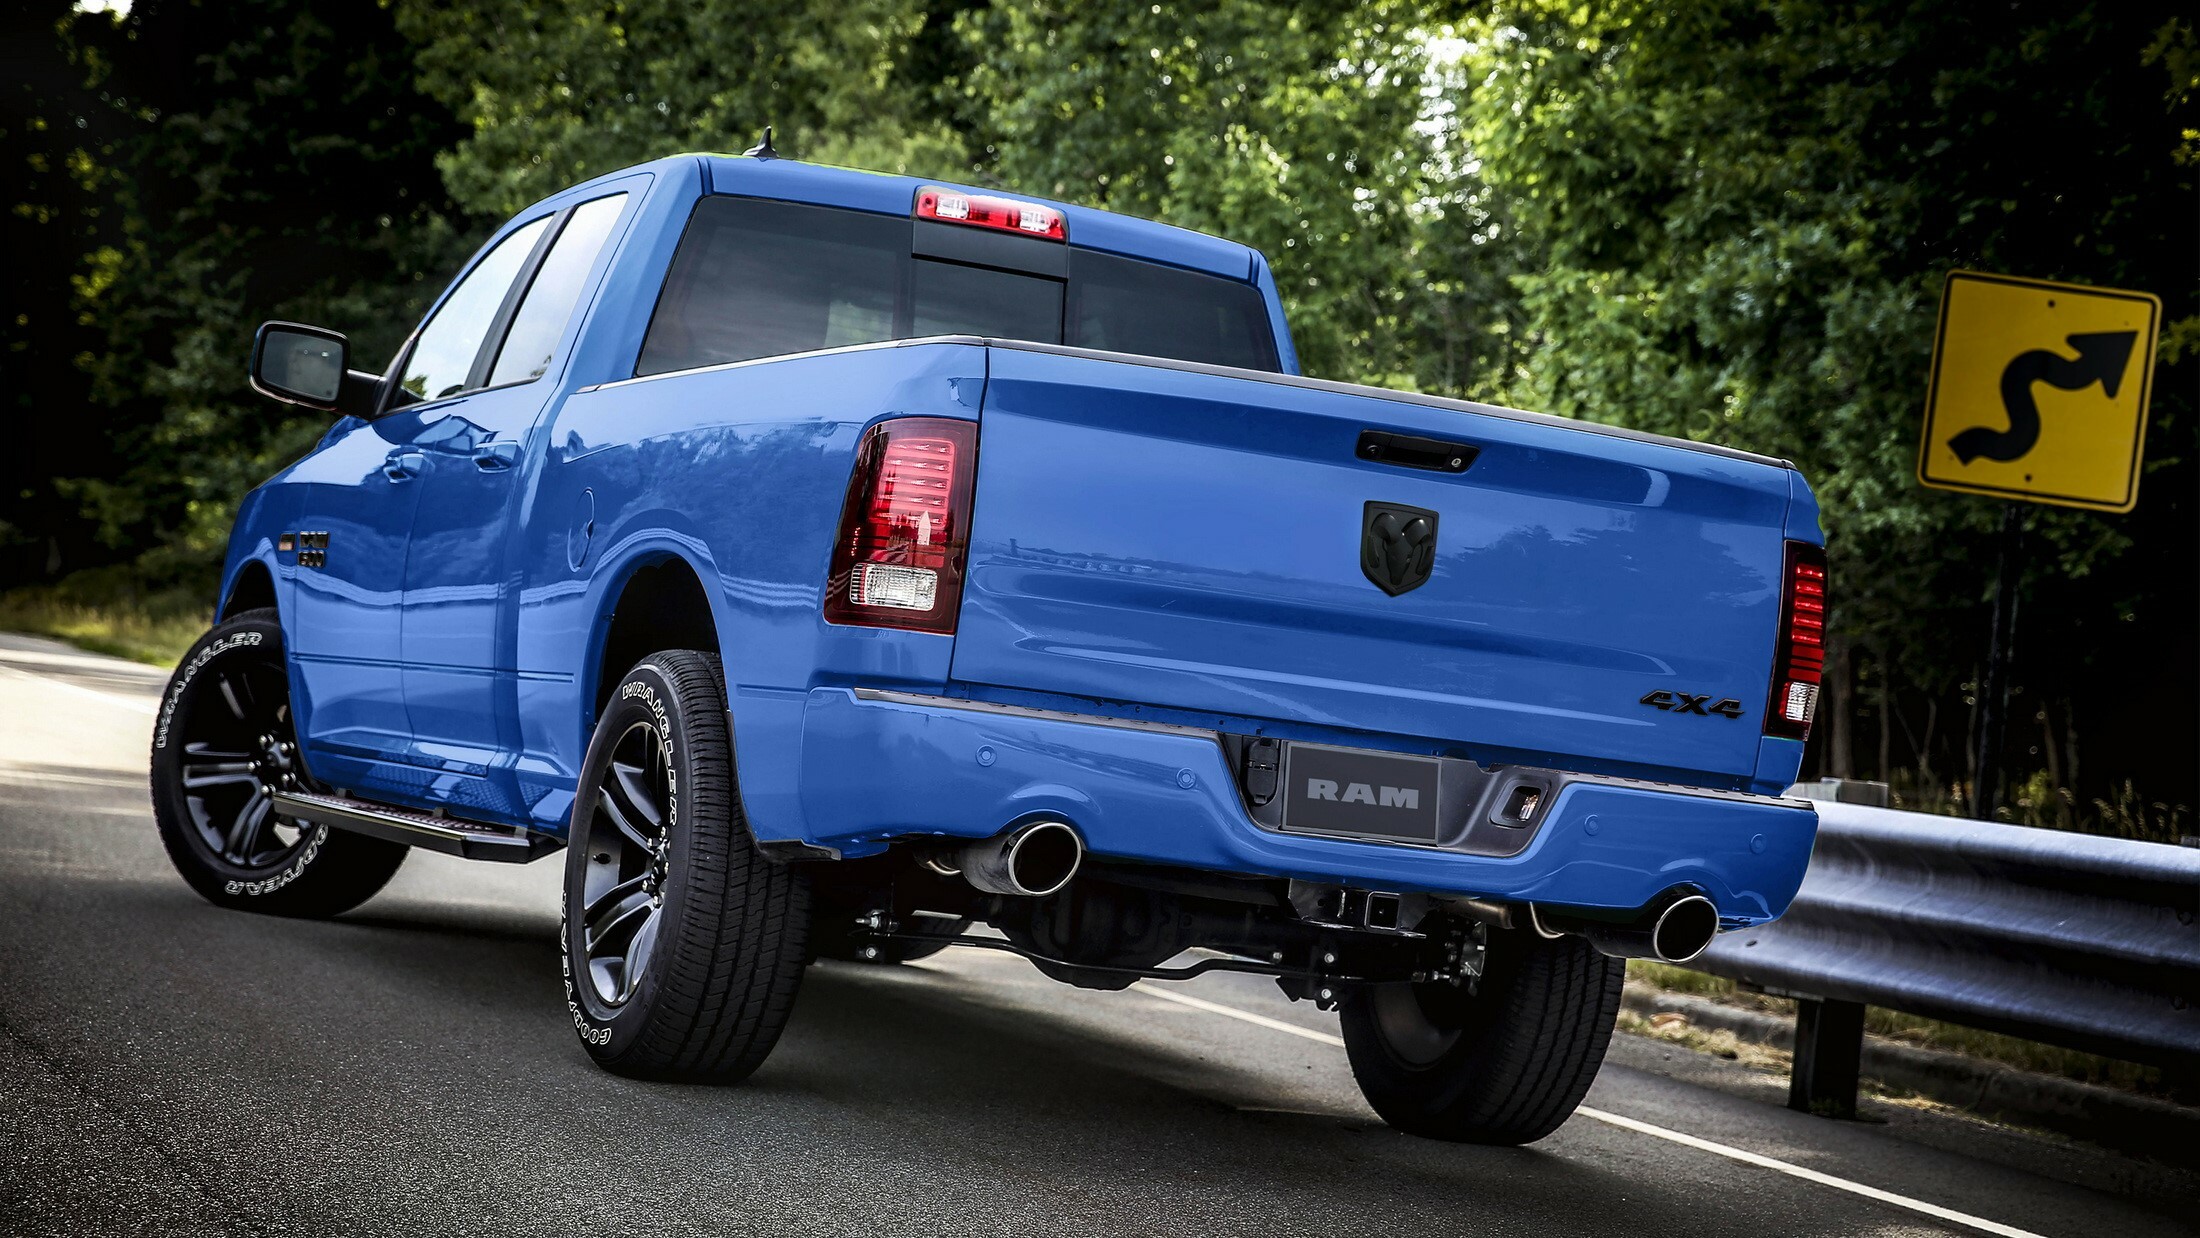
That's thanks to values increasing for a wide variety of used vehicles, from pickup trucks to compact sedans and just about everything in between. The Ram 1500 was the used vehicle whose value increased the most over the last four years. In 2019, it cost an average of $27,324, and now its value has increased by nearly 60 percent, to $42,881, accordin to iSeeCars' study.
"Used car shoppers have to face the stark reality of paying more for cars with higher mileage compared to the pre-pandemic used market," said Brauer. "It's news nobody wants to hear, but the numbers don't lie. This means due diligence in knowing a used car's market value and confirming its service history is more important than ever."
| Rank | Model | Avg. Price 2019 | Avg. Price 2023 | Pct. Change |
| 1 | Ram 1500 | $27,324 | $42,881 | 56.90% |
| 2 | Toyota Corolla | $14,220 | $21,308 | 49.80% |
| 3 | Toyota Camry | $17,107 | $25,537 | 49.30% |
| 4 | Honda Civic | $16,577 | $24,301 | 46.60% |
| 5 | GMC Sierra 1500 | $32,862 | $47,364 | 44.10% |
| 6 | Honda Accord | $18,627 | $26,658 | 43.10% |
| 7 | Hyundai Elantra | $13,200 | $18,744 | 42.00% |
| 8 | Toyota RAV4 | $20,640 | $29,094 | 41.00% |
| 9 | Jeep Wrangler | $25,936 | $35,953 | 38.60% |
| 10 | Honda CR-V | $20,714 | $28,401 | 37.10% |
| 11 | Chevrolet Silverado 1500 | $29,629 | $40,359 | 36.20% |
| 12 | Nissan Rogue | $18,015 | $24,241 | 34.60% |
| 13 | Ford F-150 | $31,520 | $42,104 | 33.60% |
| 14 | Ford Explorer | $26,502 | $34,904 | 31.70% |
| 15 | Hyundai Tucson | $18,270 | $23,869 | 30.60% |
| 16 | Chevrolet Malibu | $15,735 | $20,372 | 29.50% |
| 17 | Toyota Tacoma | $28,443 | $36,675 | 28.90% |
| 18 | Subaru Crosstrek | $20,763 | $26,480 | 27.50% |
| 19 | Mazda CX-5 | $20,580 | $26,191 | 27.30% |
| 20 | Chevrolet Equinox | $17,954 | $22,685 | 26.30% |
| 21 | Subaru Outback | $23,433 | $29,413 | 25.50% |
| 22 | Jeep Grand Cherokee | $27,454 | $34,307 | 25.00% |
| 23 | Toyota Highlander | $29,153 | $36,311 | 24.60% |
| Average | $23,351 | $34,491 | 47.70% |