- Demand for the all-electric Lyriq skyrocketed during the first quarter of this year.
- Buick was the only GM-owned brand in the U.S. to record a sales increase in Q1.
- Overall, GM sold 594,233 vehicles in the U.S. in the first three months of the year.
General Motors has released its sales numbers for the January-March period and it makes for interesting reading, particularly when you look at the Cadillac brand.
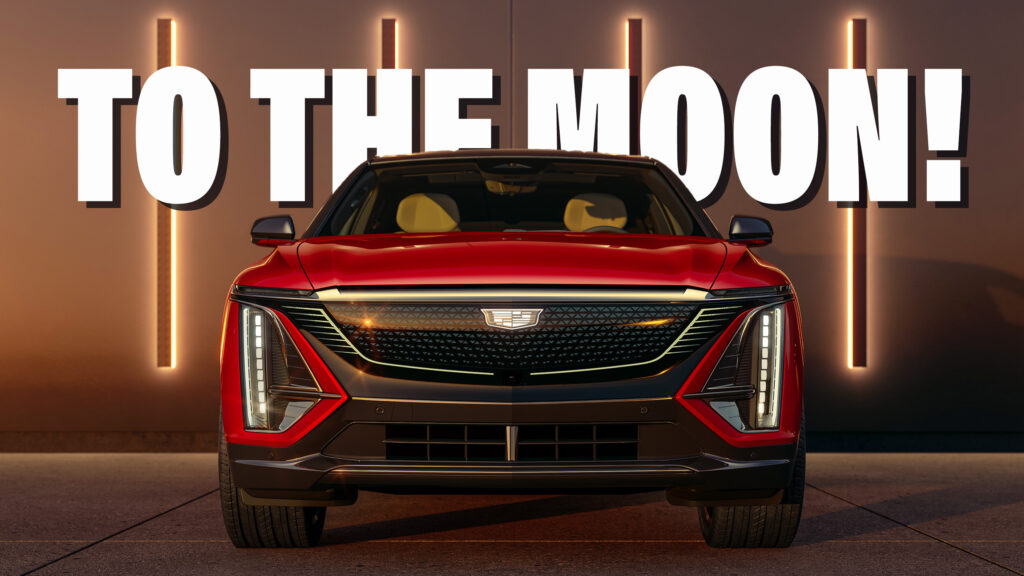
Through the first quarter of the year, GM sold 594,233 vehicles in the United States. This represents a 1.5% decline from the 603,208 units sold in Q1 2023 and comes despite this past quarter having two extra selling days than last year. Cadillac also reported a 2.4% decline in overall sales but there was one model which experienced significant growth in demand; the all-electric Lyriq.
Read: Cadillac Lyriq Back On The $7,500 Tax Credit Nice List
In Q1 2023, Cadillac sold only 968 Lyriqs across the United States, which was a rather disappointing figure for the brand’s first all-new EV. However, this year, sales have soared by 499.2%, with 5,800 Lyriqs finding new homes. As a result, the Lyriq now ranks as Cadillac’s third best-selling model, following the Escalade (9,135 units) and the XT5 (6,275 units), marking a significant achievement.
Unfortunately for Cadillac, this is where the good news ends. Sales of the CT4 have fallen 36.1%, some 34.2% fewer CT5s were sold in Q1, and deliveries of the Escalade also slipped 1%. Additionally, 28% less XT4s were sold during the quarter, sales of the XT5 dropped by 13.9%, and sales of the XT6 have also fallen 3.3%.
Nevertheless, with 5,800 units shifted during Q1, the Lyriq is now Cadillac’s third best seller behind the Escalade (9,135 units) and the XT5 (6,275 units), which is a pretty impressive feat.
GMC Hummer Sales Up 83,300%
The Chevrolet and GMC brands also reported sales declines in Q1. At Chevy, deliveries slipped 2.1% from 398,141 units to 389,763 units. Sales at GMC declined by 4.8% from 130,608 to 124,378. Interestingly, there was one GMC model that saw a huge rise in sales: the GMC Hummer EV, in both pickup and SUV guises. In Q1 2023, GMC sold just 2 examples, but last quarter delivered 1,668, representing an 83,300% increase.
More: Ioniq 5 Sales Up 18 Percent This Year As Hyundai Posts All-Time Record Q1
Buick was the only GM brand in the U.S. to report a growth in sales this year. It shifted 44,385 units in Q1, a 16.4% rise from the 38,138 that it had sold in Q1 2023. This rise can be attributed almost exclusively to the new Envista that shifted 9,662 units in the first three months of the year.


