
- January’s average new car price hit a record as incentives quietly pulled back.
- Affordable models still exist, but true entry-level cars keep disappearing.
- Electric car prices slip slightly, but EV sales have taken a dramatic slide.
You might have set a New Year’s resolution to slim down, but new-car prices made no such commitment. According to fresh industry data, prices just set another record for January, proving that handing over $50k for a virgin vehicle is basically normal now. But the number of people who think buying an EV is the normal thing to do has dropped dramatically.
More: A Third of Americans Are Priced Out Of New Cars, And It’s Getting Worse
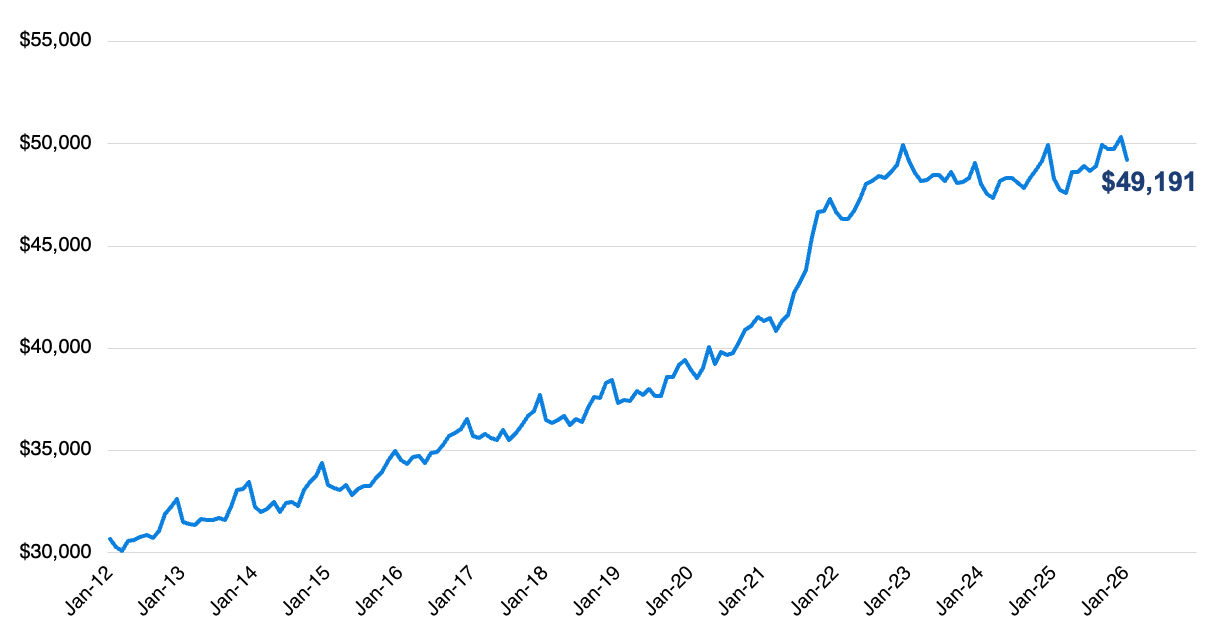
The average transaction price in January reached $49,191, up nearly 2 percent from a year earlier and the highest ever recorded for the month, according to KBB. Although prices dipped slightly from December, Cox Automotive called the drop “seasonally normal,” explaining that the market usually “takes a breather” after year-end, when luxury vehicles make up a larger share of sales.
The average new-vehicle manufacturer’s suggested retail price (MSRP), commonly called “the asking price,” also kept climbing, now sitting at $51,288 and staying north of fifty grand for 10 straight months.
New-Vehicle Average Transaction Price
Last month’s pricing uptick came even as sales mix shifted away from year-end luxury volumes. “We hit a new January high even as prices naturally pulled back from December’s luxury-heavy finish,” said Erin Keating, executive analyst at Cox Automotive.
“Consumers are still finding plenty of options below the industry average, especially in core segments like best-selling compact SUVs, but the disappearance of true entry-level vehicles continues to lift the floor higher.”
Incentives Pull Back Hard
Incentives fell to about 6.5 percent of transaction prices, down from higher levels late last year, meaning buyers are shouldering the burden of those higher prices. Automakers are clearly in margin-protection mode, offering just enough in the way of deals to keep metal moving but not enough to feel generous.
Luxury models and big pickups got the juiciest offers, while compact and midsize cars were left mostly to fend for themselves.
Few Bargains Remain
Compact SUVs remain the value choice. With average prices around $36,000 and down 0.6 percent, they sit well below the industry average and continue to dominate sales. Meanwhile, true bargain basement cars are basically extinct. With the Mitsubishi Mirage gone and the recently axed Nissan Versa reduced to whatever stock is still hanging around, the US market has waved goodbye to the sub $20,000 new car.
At the other end of the spectrum, full-size pickups are still living large. Average prices in that segment remain comfortably above $70,000, and buyers are still lining up, with more than 150,000 big trucks finding homes last month.
January marked the fifth consecutive month where full-size pickups averaged over $70K, reinforcing their outsized role in propping up the market average. Subcompact cars, by contrast, struggle to attract more than a few thousand takers a month. Fewer than 4,000 were sold industry-wide last month.
EVs Shunned
Electric vehicle prices actually slipped to around $55,700, down 0.6 percent lower than a year ago, although Tesla’s fell 2.2 percent in the same period. Incentives for EVs also cooled sharply, dropping to 12.4 percent of ATP, down from 18.3 percent in December. Even at those reduced levels, they remain well above the industry average.
However, we wouldn’t be surprised if they are kicked back in to shore up demand, which has dropped alarmingly, according to the data.
KBB says only 66,000 EVs were sold in January, being down a fifth from January 2025, and you can bet the loss of tax credits from October played a big role. In fact, that total reflects a nearly 30 percent year-over-year drop and a 20 percent decline from December. Tesla accounted for about 60 percent of total EV sales.