The combination of rising supplies of new vehicles and sluggish sales resulted in a decrease in the average price Americans paid for new vehicles in the first month of 2024. Across the industry, the average transaction price (ATP) for a new vehicle in January stood at $47,401.
A decrease of 2.6 percent from December isn’t particularly surprising, considering that January typically sees slower sales, with luxury vehicle sales often spiking in the final month of the year. However, what’s more notable is that the latest data reveals a 3.5 percent drop in ATPs compared to January 2023.
“The year-over-year new-vehicle ATP decline of 3.5% is notable,” said Erin Keating, executive analyst at Cox Auto. “Prices have been trending downward for roughly six months now as automakers are sweetening deals to keep the sales flowing.”
Read: These Are The Best Selling Used Cars, Trucks And EVs Of 2023

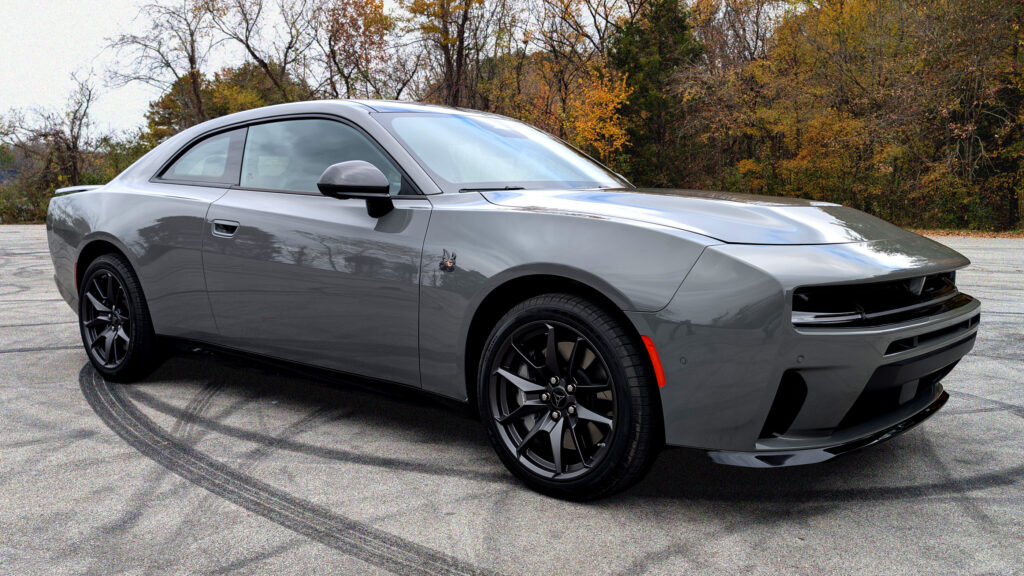
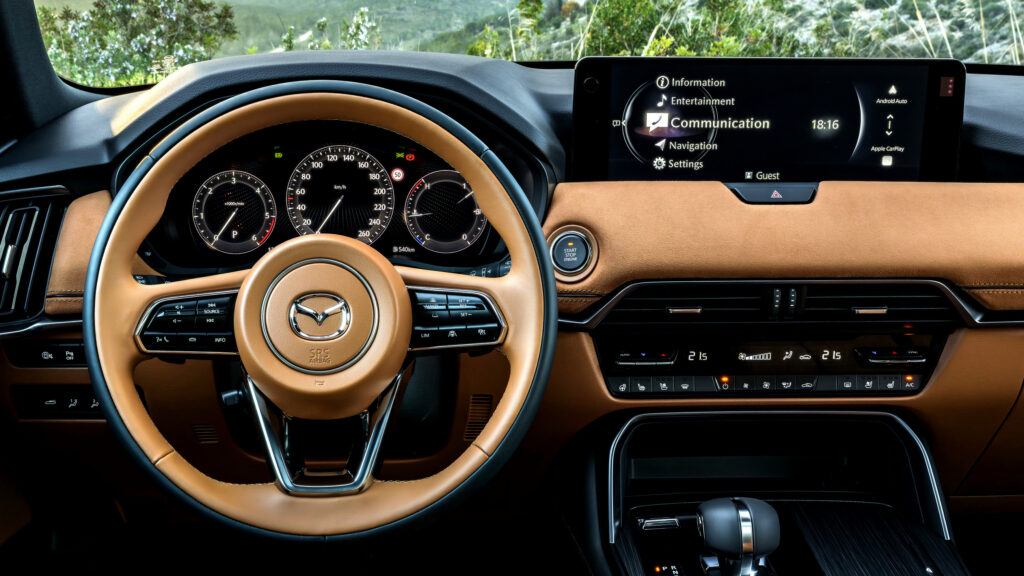
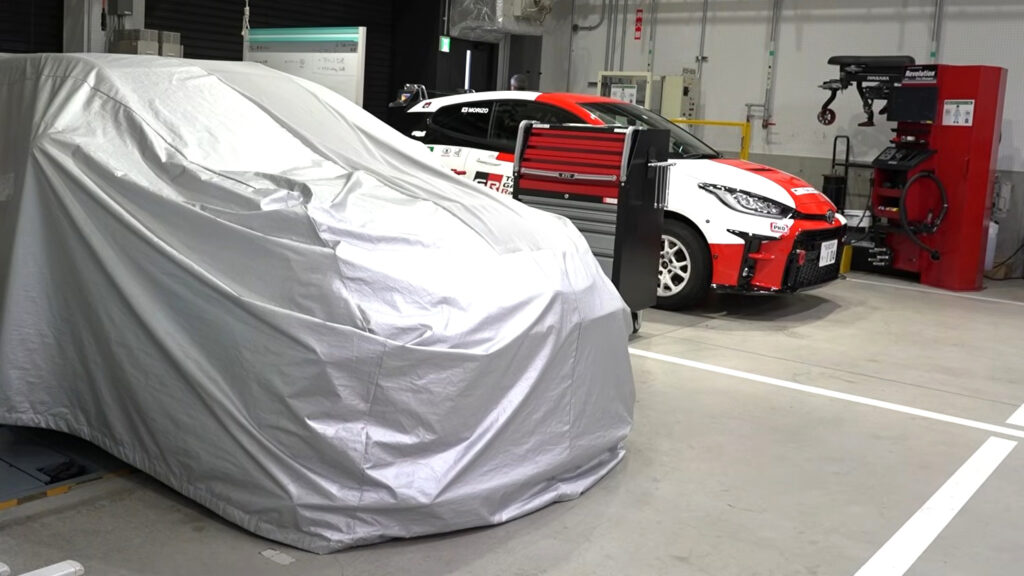
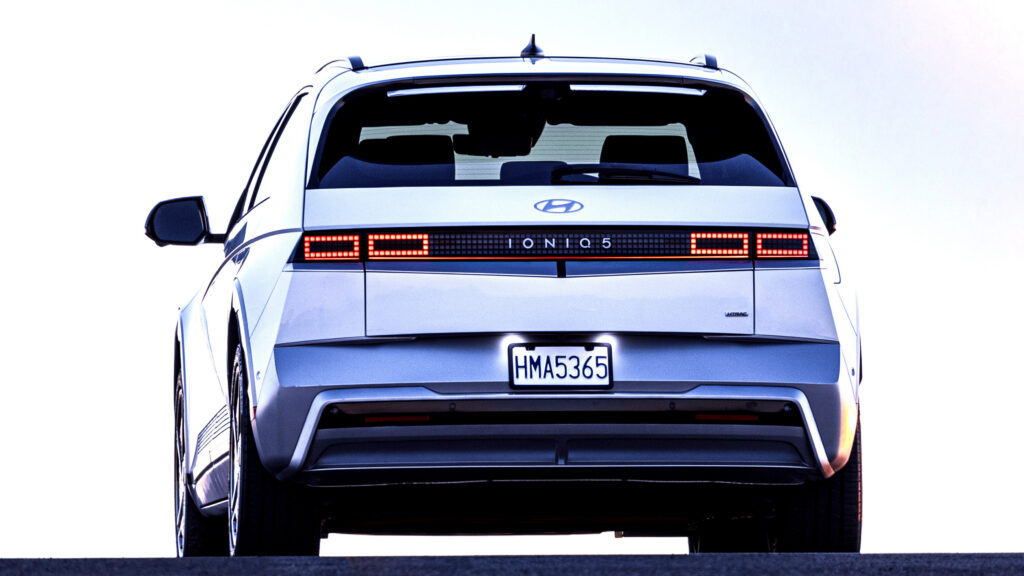
On average, customers paid more for vehicles from just five automakers year-over-year. Subaru’s ATPs saw a slight increase of 0.2 percent, while the Toyota Motor Corporation’s rose by 2.9 percent. Stellantis experienced a 3.3 percent increase, the Hyundai Motor Group’s ATPs were up by 3.9 percent, and Mazda’s saw a significant rise of 5 percent. In contrast, Tesla’s ATPs experienced the most substantial decrease industry-wide, plummeting by over 20 percent compared to January 2023.
More: Weak Sales Lead To Biggest Inventory Since Pandemic, Stellantis Drowning In Unsold Cars
As Keating pointed out, automakers and dealers have been re-implementing incentives and discounts to lure in customers. During the peak of the pandemic, a shortage of supply meant that shoppers were unable to find deals and often encountered markups instead.
Last month, the average incentive amounted to 5.7 percent of the transaction price of a new vehicle. That’s up slightly from December, when it was at 5.5 percent, and up almost 100 percent from January 2023, when incentives averaged just 2.8 percent of ATP.

Not all vehicle segments have been equally impacted, however. Discounts for small pickups, full-size SUVs, and minivans were notably low, accounting for less than 3 percent of ATP. This indicates that these types of vehicles are currently experiencing particularly high demand right now.
Weaker demand for premium models
Conversely, demand for luxury vehicles seems to be weakening. The ATPs across the segment fell to $60,978 in January, down from $62,834 just a month earlier, and the lowest they’ve been since the summer of 2021. As compared to January 2023, ATPs for luxury vehicles fell by 9.7 percent, in general, and compact luxury SUVs have been particularly affected, as the price consumers paid dropped 11.9 percent year-over-year.

Overall, incentives for luxury vehicles averaged 6.2 percent of ATP, which is more than twice what they amounted to a year earlier. The segment also accounted for just 19.8 percent of industry-wide sales in January, down from 20.6 percent in December.
Prices are also falling in the non-luxury segment, and were 2.1 percent lower year-over-year in January. Similarly, the average price paid for an EV in January was $55,353, which is 10.8 percent lower than a year earlier. However, ATPs increased by 3.2 percent, as compared to December, when prices were the lowest they had been in a year, sparking fears about softening EV demand.
The average listing price of new vehicles is also on the decline. According to Cox Auto data, the ALP stood at $47,142 at the beginning of February, marking a 1 percent decrease compared to the previous year, with a downward trend continuing. While listing prices were elevated at the end of December, they began to decrease in the latter half of January, and have since continued to drop by a further 1 percent per week.