


- Average transaction price hovers near $50K with no slowdown.
- Affordable cars fade as luxury trucks and SUVs dominate sales.
- EV prices soften slightly but rely heavily on rising incentives.
If you were hoping falling interest rates, bigger incentives, or sheer consumer exhaustion might finally drag new-car prices back to Earth, number-crunching industry experts have some bad news.
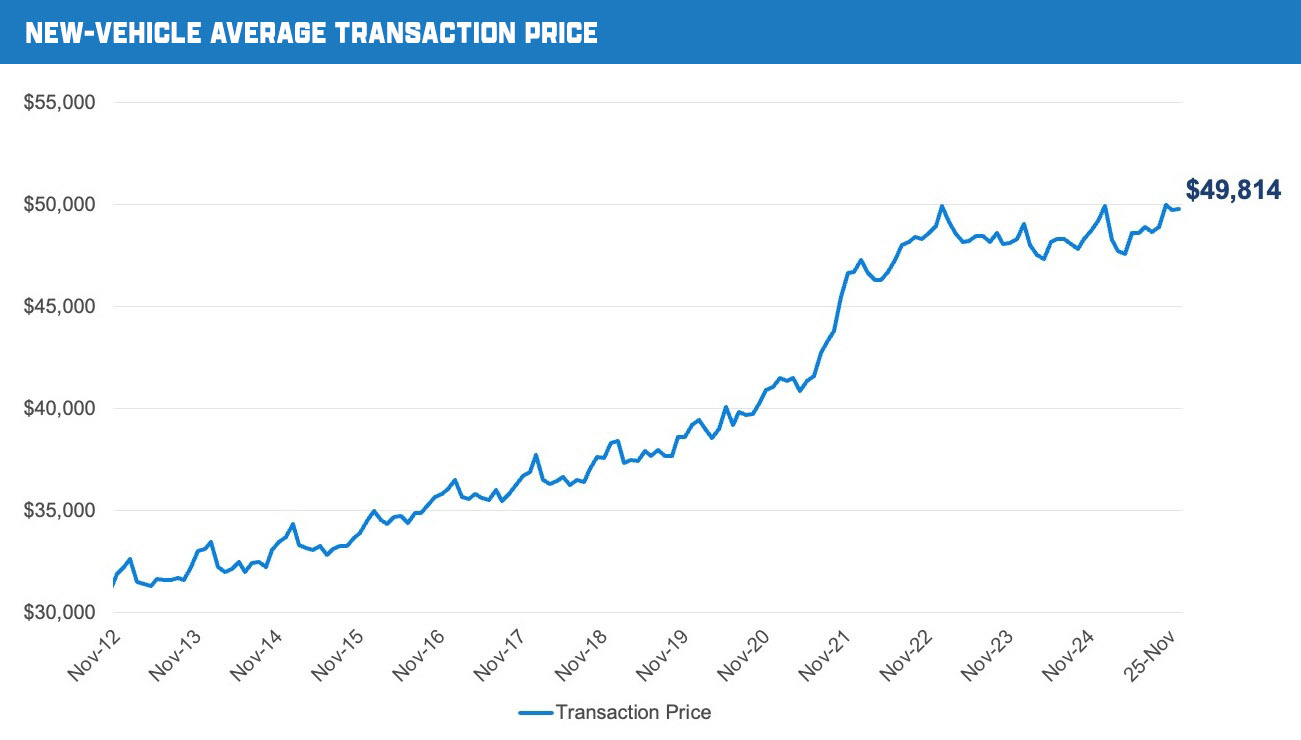
According to the latest Kelley Blue Book data, the average transaction price of a new vehicle in the US hit $49,814 in November, and it’s showing no real sign of dropping.
Also: Nobody Wants These 2024 Models And Dealers Are Drowning In Inventory
That figure is up 1.3 percent year over year and effectively unchanged from October, suggesting the industry has settled into a comfortable rhythm where fifty grand is the new normal.
Cox Automotive says prices usually peak in December, meaning the holiday season could push things even higher as buyers gravitate toward well-optioned trucks, luxury SUVs, and vehicles that require six figures of income and very little financial anxiety.
Fewer Incentives
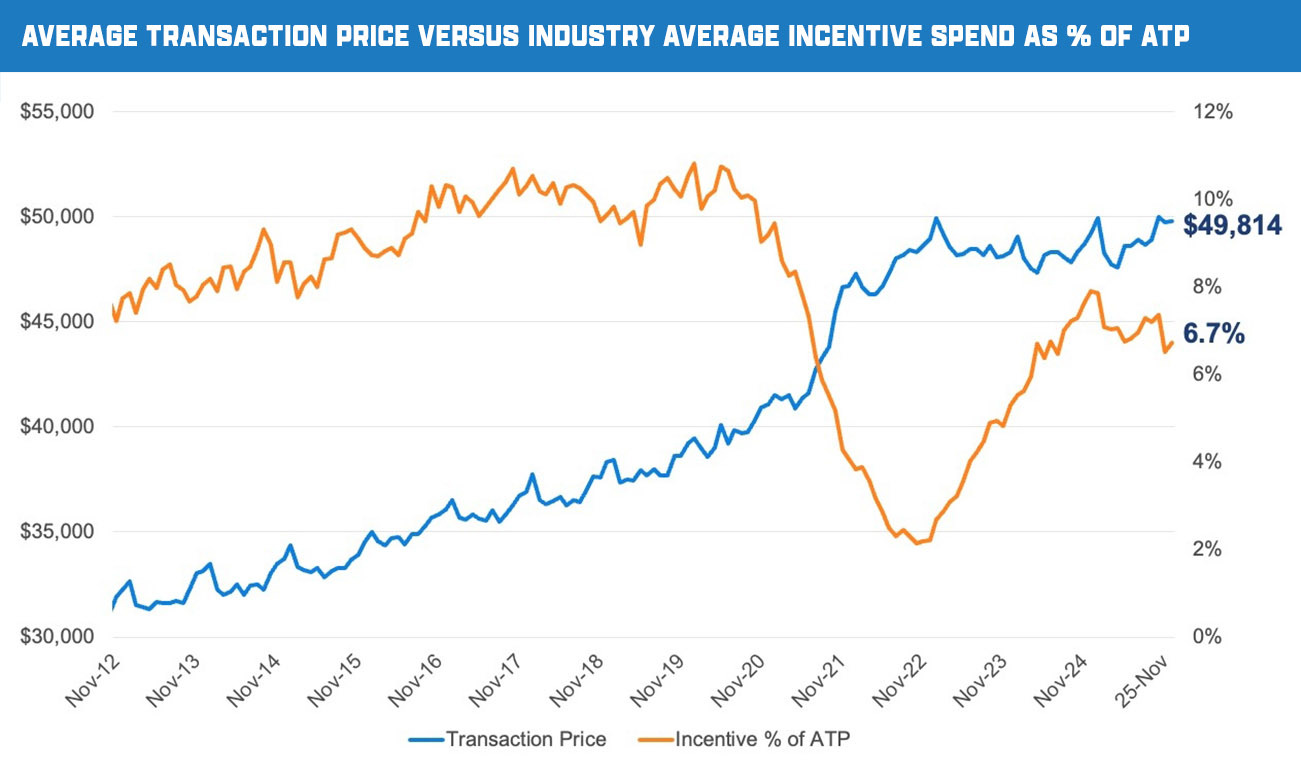
Incentives are still around, but they are not doing the heavy lifting they once did. In November, incentives averaged 6.7 percent of average transaction prices, down from nearly 8 percent a year ago.
Automakers simply do not need to discount aggressively when buyers keep selecting expensive trims with panoramic roofs, giant screens, and fancy wheels.
The data makes one thing clear. Cheap cars are disappearing from the sales mix. Vehicles with MSRPs under $30,000 accounted for just 7.5 percent of November sales, down sharply from 10.3 percent a year earlier.
Meanwhile, more than one in 10 vehicles sold cost over $75,000. The most popular sub-$30K survivors remain familiar names like the Toyota Corolla, Chevrolet Trax, and Hyundai Elantra, clinging on like endangered species.
While transaction prices may have leveled off for now, average MSRPs, commonly known as the asking price, are still inching upward, reaching $51,986 in November. That marks a 1.7 percent increase over last year.
Blame Pricey Trucks
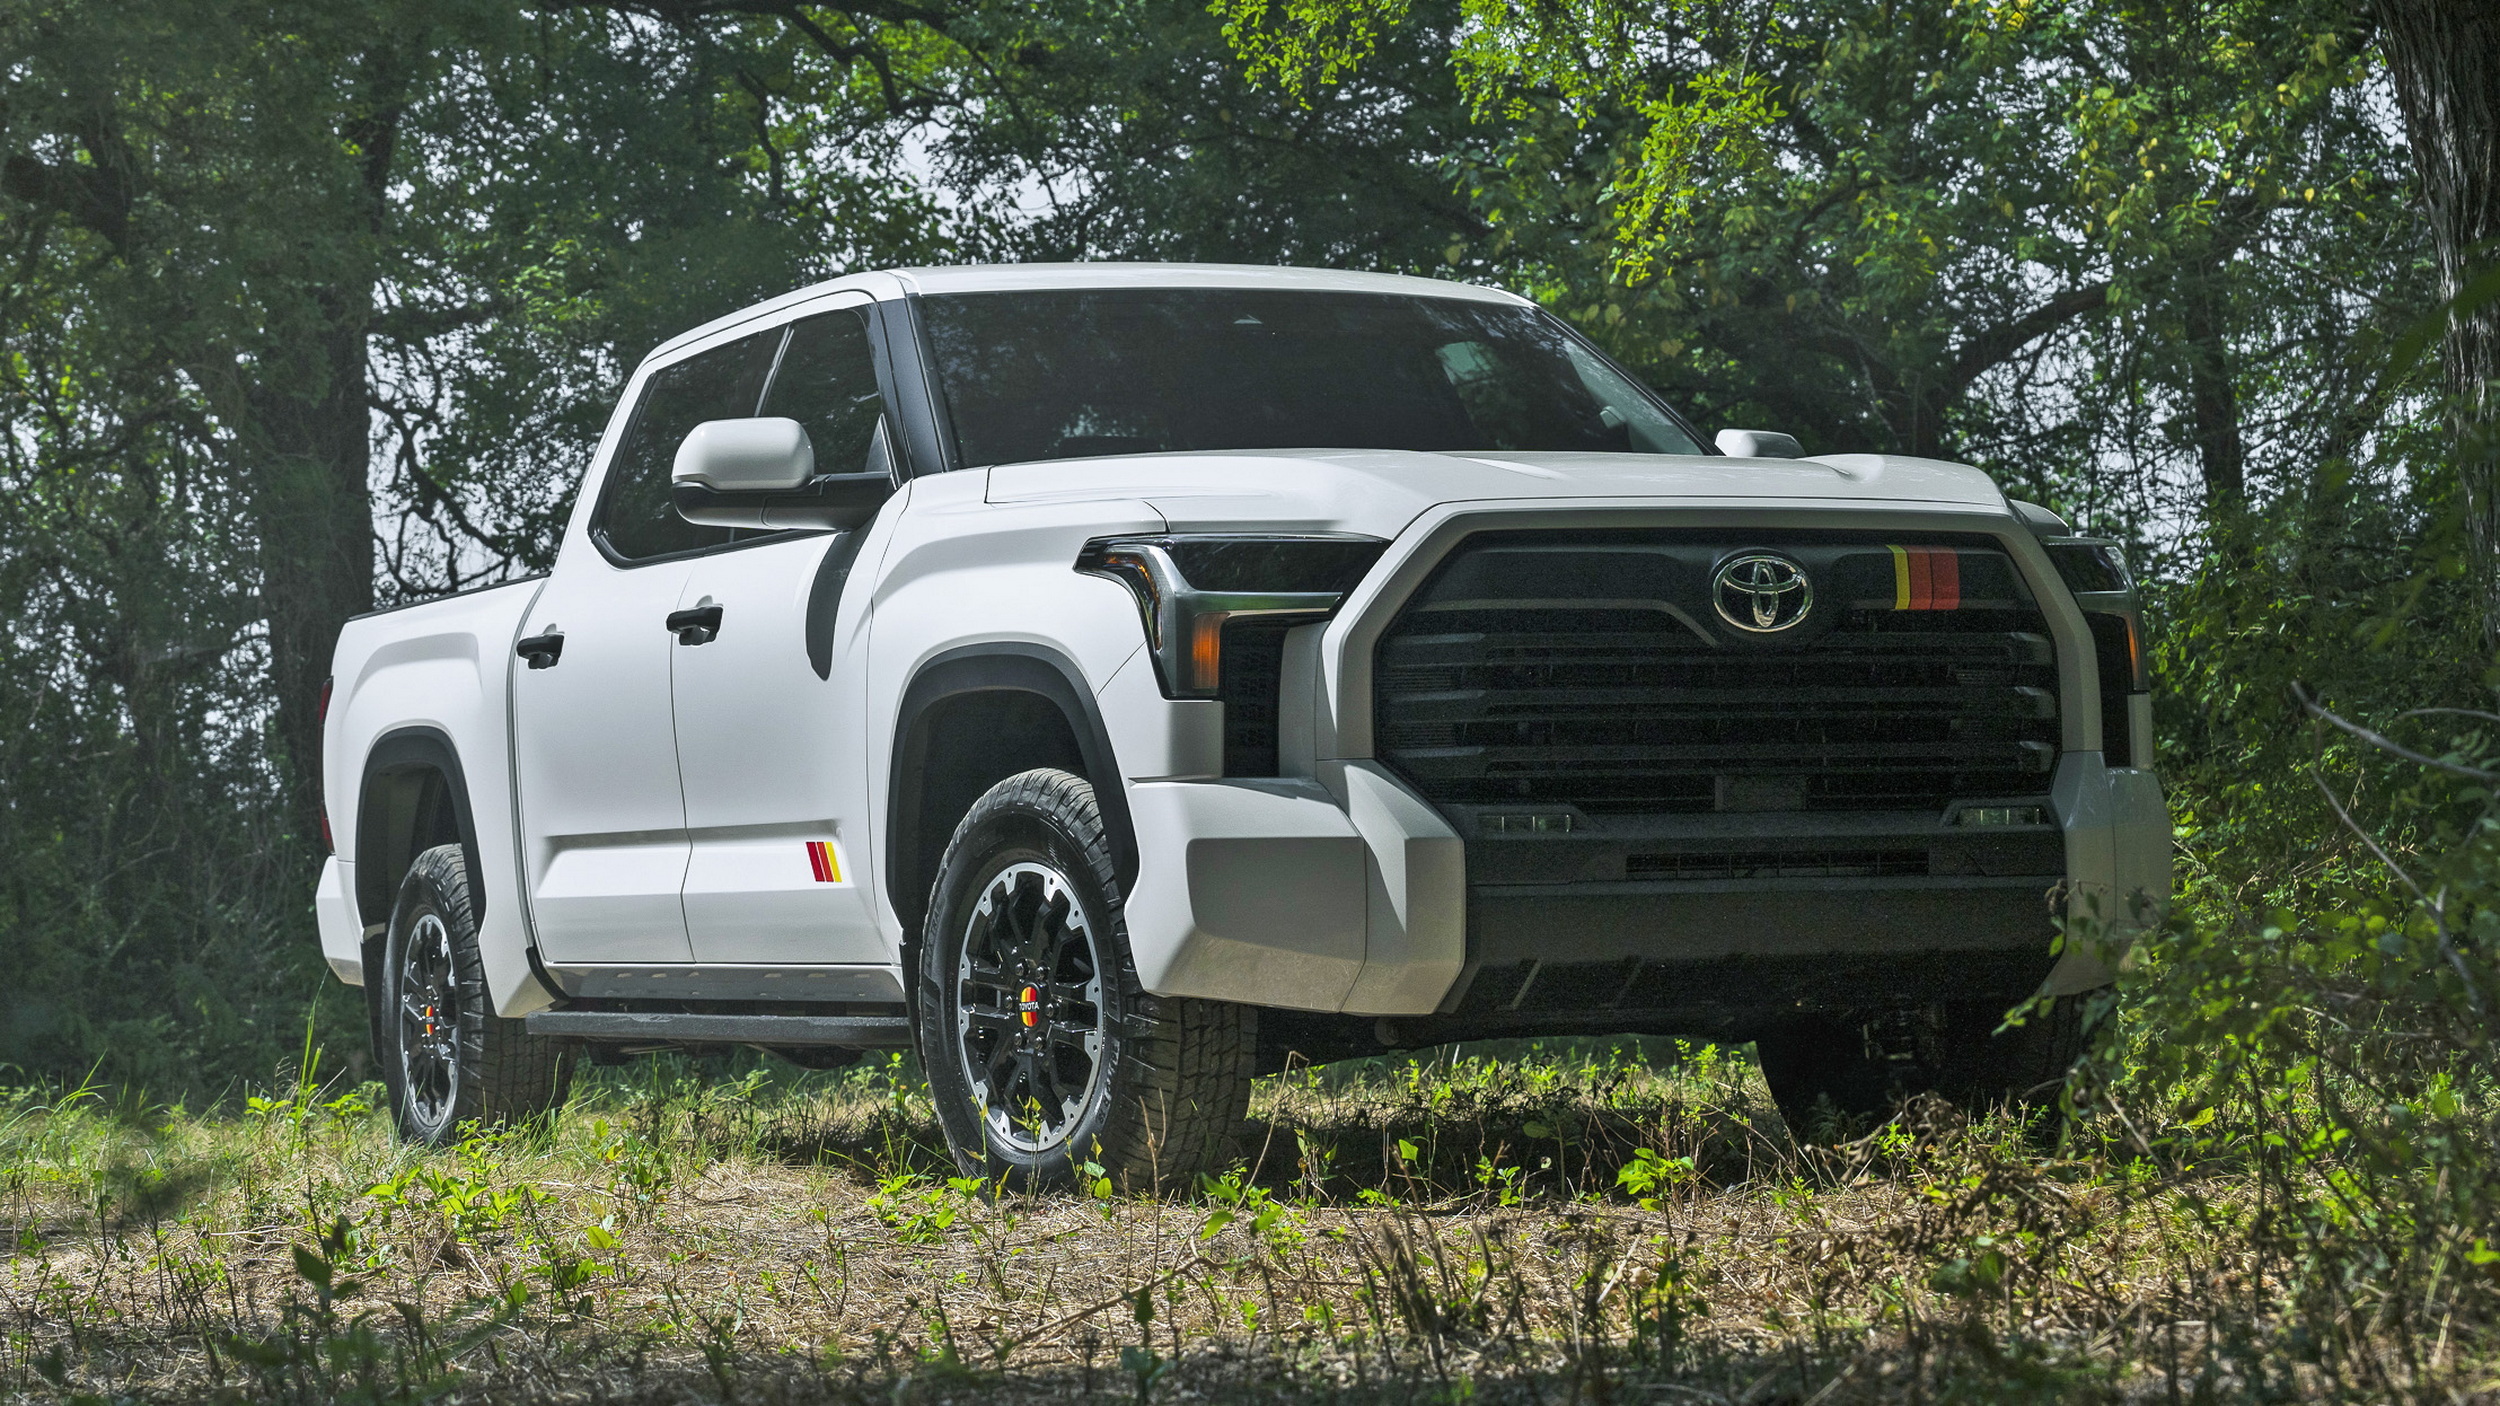
Trucks continue to be a major contributor to price inflation. Full-size pickups now average more than $70,000 for the third month in a row and accounted for over 14 percent of all sales in November, with nearly 183,000 units delivered. That helps explain why the industry average keeps floating upward even when compact and midsize segments remain relatively stable.
Read: Senators Want Cheaper Cars, Even If It Means Getting Rid Of Automatic Braking
Electric vehicles add another twist. The average EV transaction price fell slightly month over month to $58,638, but remains up 3.7 percent year over year. Incentives jumped to over 13 percent of prices as sales softened again, dropping more than 40 percent compared with last year.
Tesla’s average transaction price rose to $54,310 in November, even as sales fell 22.7% year over year, largely due to sharp declines in Model 3 demand. Prices for the Model Y, the best-selling EV in the U.S., edged up slightly. Cybertruck sales fell to 1,194 units, their lowest monthly total of 2025, though its average price rose to $94,254.
Who’s Really to Blame?
According to Cox Automotive Executive Analyst Erin Keating, today’s prices aren’t just the result of inflation or supply hangovers, but they reflect what consumers are choosing to buy.
“It’s important to remember that the KBB ATP reflects what consumers choose to buy, not what’s available,” she explained.
“Many new-car buyers today are in their peak earning years and are less price-sensitive, opting for vehicles at the higher end of the market to get the features and experiences they value most. In November, sales of vehicles priced above $75,000 outpaced those below $30,000, underscoring this preference for premium products” Keating added.
The takeaway is simple. Prices are high because buyers keep buying high. Until that changes, the average US driveway will continue to look alarmingly expensive.
We just have to hope the trend doesn’t discourage automakers from developing and building the more affordable models that less affluent Americans still need.